Methodology & Attribution
Reference page for TickerTape's multi-agent equity-analysis pipeline: architecture, agent roles, formulas, thresholds, data sources, and citations. For the synthesised argument behind these choices — vision, design principles, six purpose-built backtests, limitations, and roadmap — read the full thesis →.
Architecture inspired by TradingAgents (Xiao et al., 2024). TickerTape extends it with a live FRED Macro Analyst, deterministic Entry Planner, dividend ROI analysis, and sector-aware Federal Reserve overlays.
How analysis runs
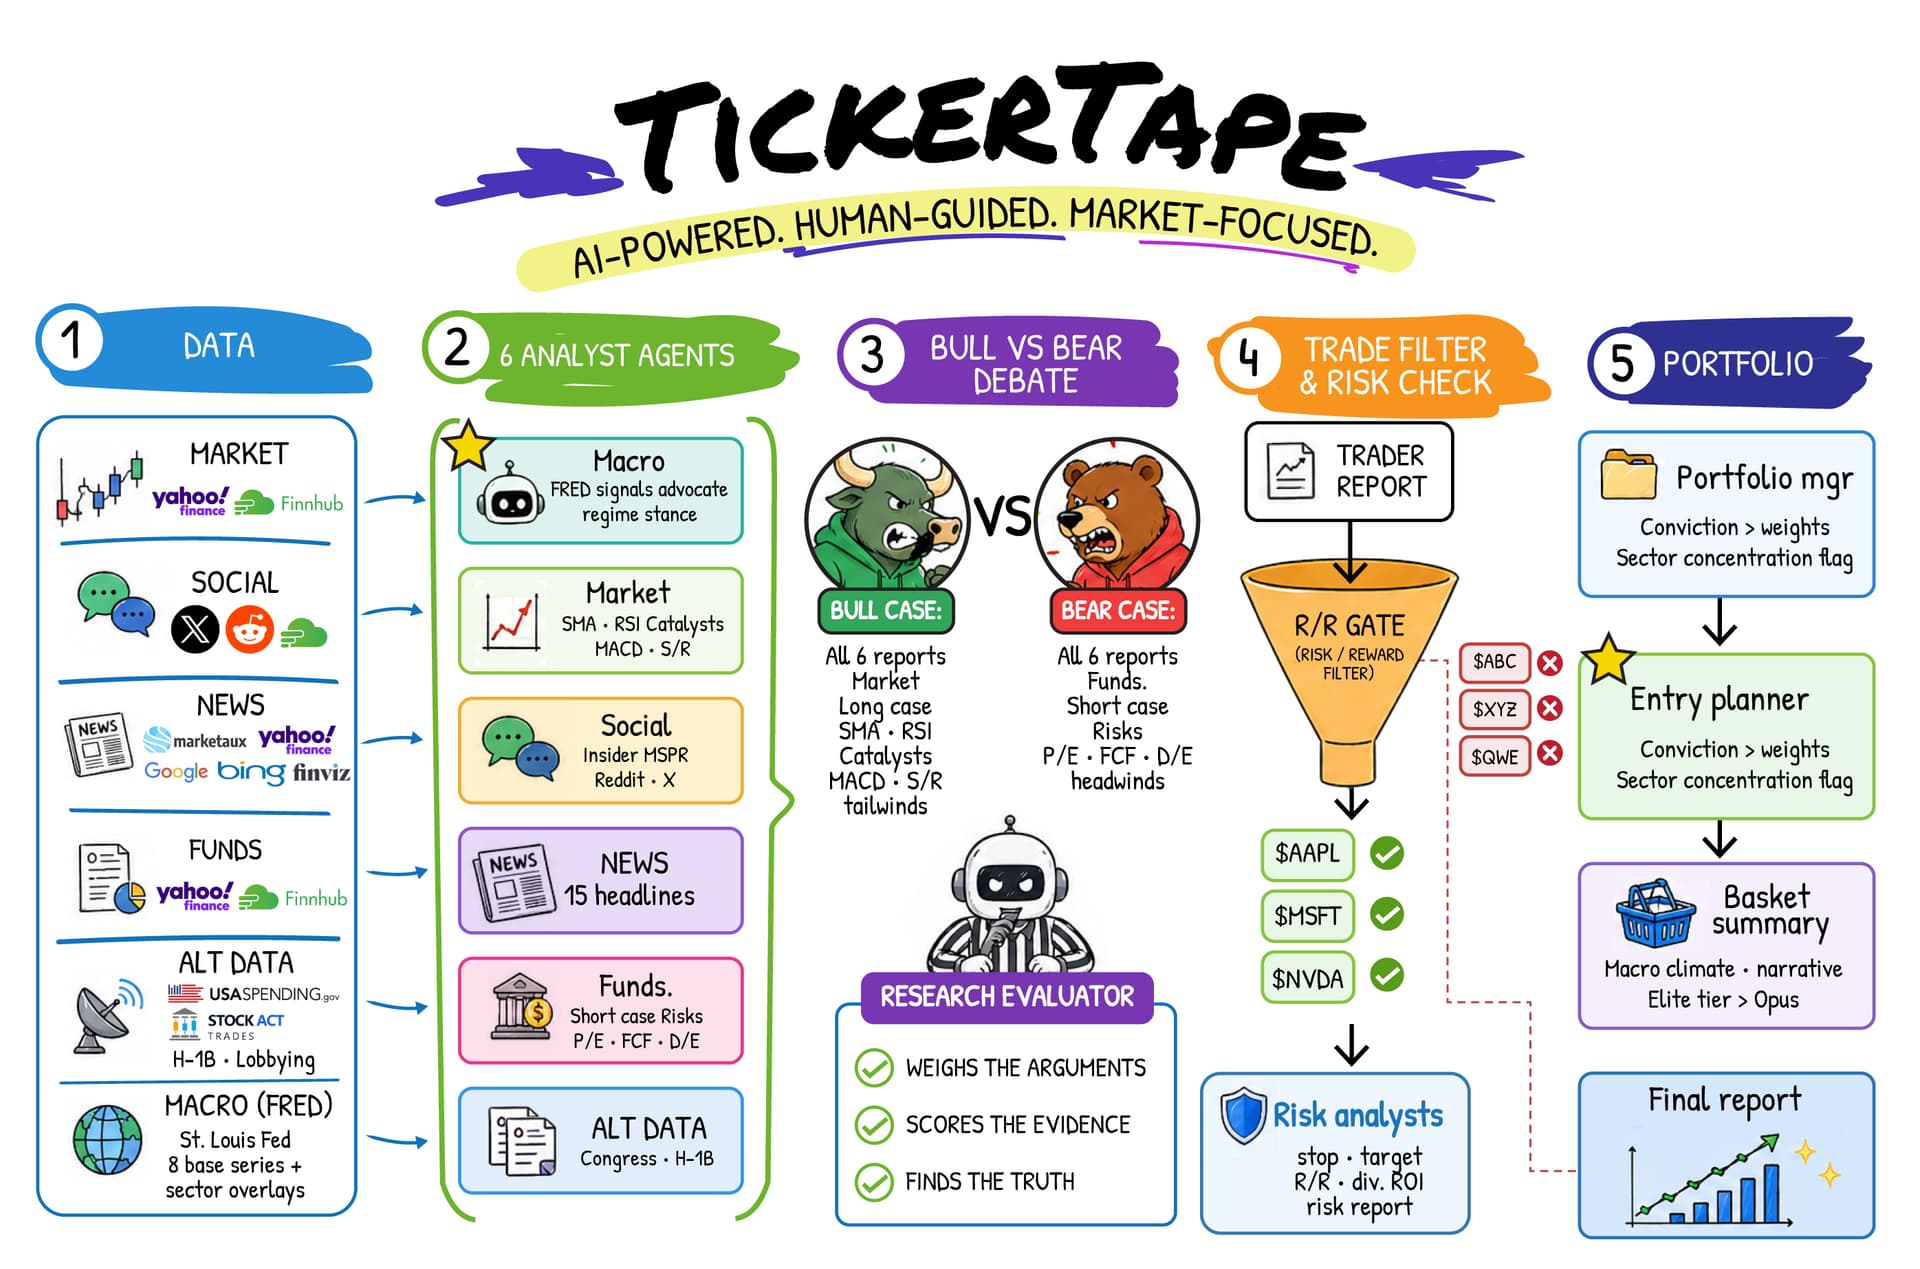
Each ticker is processed sequentially through five phases. Analyst agents run in parallel within Phase 2 to minimise total wait time.
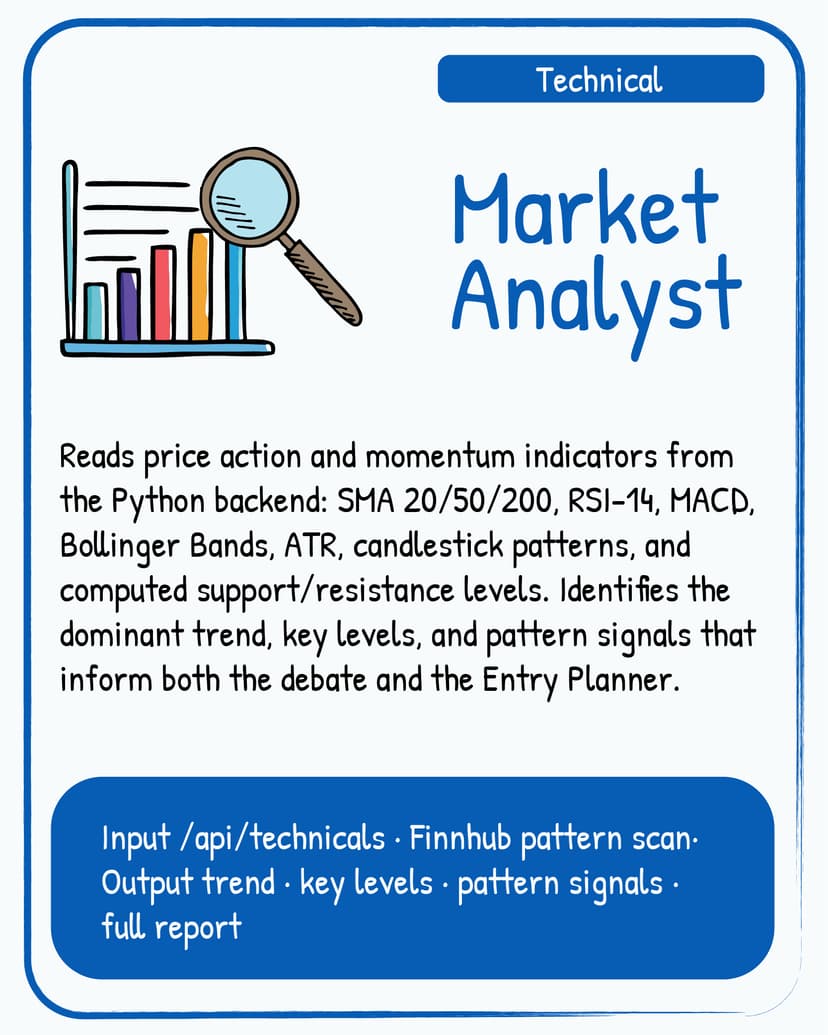
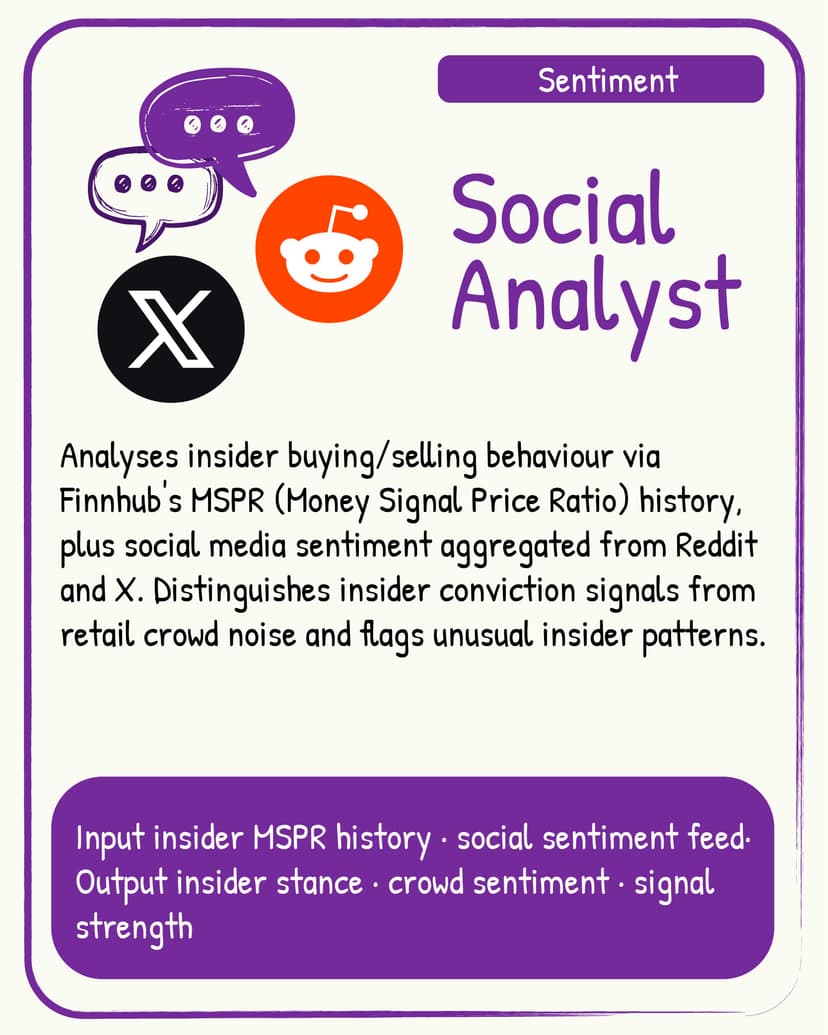
Agent Descriptions
Each agent has a clearly scoped role. Agents only see the data relevant to their specialisation — no agent has access to another agent's internal reasoning until the debate phase.


Effort Tiers & Model Choice
The tier selector in the toolbar controls debate depth and the default model. Within each tier you can override the model from the settings panel (⚙) — choices persist across sessions.
All analysts run in parallel with no debate phase. Best for a fast directional read or initial screening when time matters more than depth.
Full analyst suite plus one full bull/bear debate round. The best balance of depth and speed — recommended for most real decisions.
Maximum depth — two full debate rounds. Use when sizing a real position. Elite supports hybrid model strategies that assign different models to research vs. synthesis roles.
The Macro Analyst is never skipped at any tier — its input is ~300 pre-derived signal labels, not raw FRED observations, so cost is negligible. The hybrid Elite strategy (GPT research + Opus synthesis) assigns each model the role it excels at: GPT's structured analytical precision for the debate, Opus's narrative reasoning for the final portfolio prose.
Risk per trade (defaults). If you do not set a custom risk budget in Analysis Settings, the app uses the effort tier: Quick 0.5 %, Deep 1.0 %, Elite 1.5 % of account equity per trade (capped by your slider range). See §Risk Management Framework.
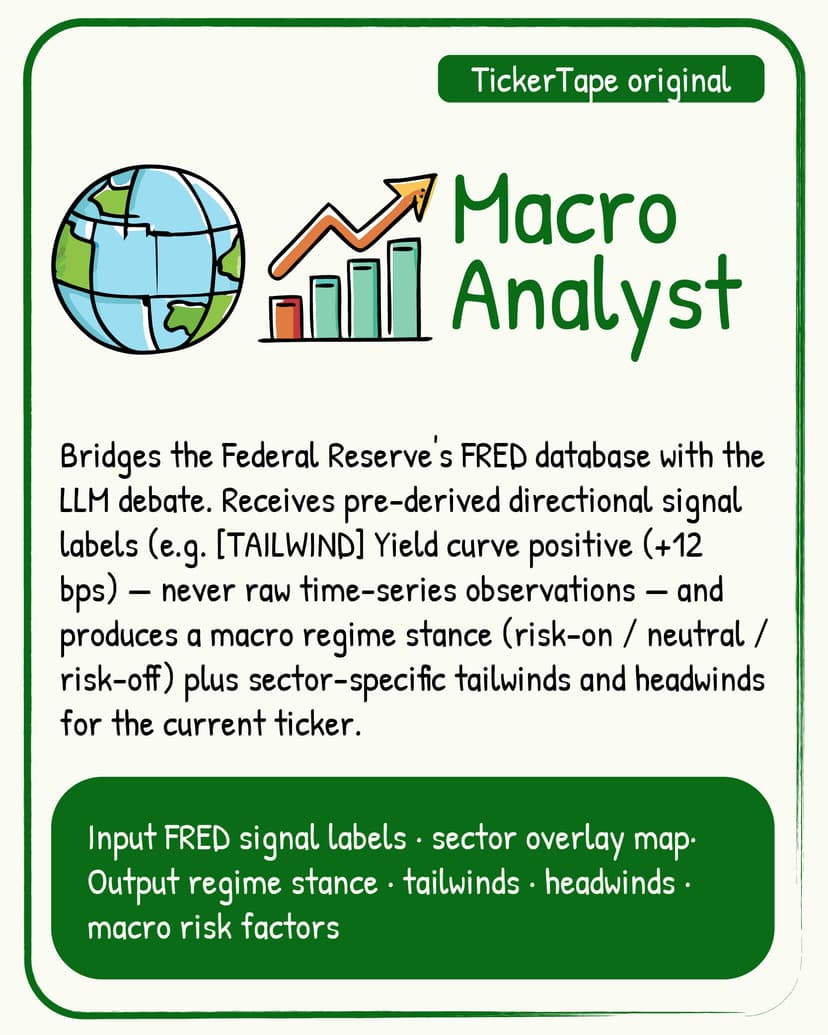
Live FRED Macro Layer
The Macro Analyst is TickerTape's primary contribution beyond the TradingAgents architecture. It bridges the Federal Reserve's FRED data API and the research debate by computing directional signal labels that summarise the macro regime without exposing raw time-series observations to any AI model.
Eight base series are always evaluated: the yield curve (T10Y2Y), the federal funds rate (DFF), the 10-year Treasury (DGS10), CPI inflation (CPIAUCSL), unemployment (UNRATE), the VIX (VIXCLS), HY credit spreads (BAMLH0A0HYM2), and IG credit spreads (BAMLC0A0CM). Up to six additional sector-specific overlays are added based on the ticker's industry:
| Sector | Additional FRED overlays |
|---|---|
| Banks / Financials | BAMLH0A0HYM2, BAMLC0A0CM |
| Homebuilders / REITs | MORTGAGE30US, CSUSHPISA |
| Energy | DCOILWTICO, DCOILBRENTEU |
| Technology | NFCI, T10Y2Y (rate sensitivity) |
| Airlines / Autos / Consumer | DCOILWTICO, GASREGW |
| Healthcare | CIVPART (labor supply) |
| Industrials | DCOILWTICO, DTWEXBGS (USD) |
FRED Terms of Use compliance. The June 2024 FRED ToS prohibits feeding raw FRED observations into generative models. TickerTape complies by computing directional labels (e.g. [TAILWIND] Yield curve positive (+12 bps)) entirely on the server before those models see the data. Raw time-series arrays are only used by the chart rendering layer — they never enter a prompt. FRED data for labels is held only in temporary server memory for the request, not written to permanent storage for that purpose.
Multi-horizon momentum. Each series is fetched over a trailing ~400-day window so its derived label carries momentum across horizons — 1-month and 3-month annualised rates of change plus the trailing-year change (percentage-point moves for rates and yields). The Macro Analyst is told to read short-horizon divergence from the year trend as acceleration or deceleration. These remain derived labels (e.g. 1M +4.9% ann · 3M +3.6% ann · 1Y +3.2%) — never raw observations. The macro glance on the home page groups indicators by category (Inflation, Employment, Interest Rates, Market, Growth) and shows the 1M / 3M / 1Y change with a one-year trend arrow.
Peer-Relative Value
When you compare two or more tickers, TickerTape re-prices each name on the basket-median P/E multiple of its peers — the classic comparable-multiples approach (Damodaran, 2012) (Graham & Dodd, 1934). It uses the price-ratio identity impliedPrice = price × peerMedianMultiple / ownMultiple (trailing P/E, forward P/E as fallback), so it composes with the multiples already on the table without a separate earnings feed. A band spans the cheapest- to richest-peer multiple.
The result appears as “Implied price (peer P/E)” and “Upside vs peers” rows in the Valuation comparison, is fed into the multi-agent Fundamentals analyst as context, and surfaces as a “Peer value” chip in the verdict drill-down.
Advisory only. Per the thesis backtest-gate rule, anything that moves sizing, stops, gates, or scores must first clear a backtest. Peer-relative value has not, so it never feeds conviction, position size, or the quality/valuation scores — it is a judgment cross-check, sensitive to peer-set composition and a single multiple, and explicitly not a price target. See thesis §9.4.
Risk Management Framework
Deterministic risk envelope on every verdict — pure arithmetic the narrative models cannot edit. R-multiple sizing (Tharp, 2007) with the 2 %/6 % envelope (Camel Finance, 2024). Full derivation, including the empirical k-sweep that motivated our k = 2.0 ATR multiplier, is in the thesis §11.3.
Per-trade math (the 2 % rule)
For each ticker that survives the R:R gate we compute, in plain dollars on a default $10,000 account:
- Capital at risk —
(price − stop) × shares. This is the dollar loss if the stop fills exactly. - Capital-at-risk % — capital at risk divided by account equity. The Trade Math badge turns green ≤ 1× budget, amber ≤ 2×, and red > 2×.
- Stop distance —
(price − stop) / price, the percent of price the stop sits below entry. - Derived position size —
riskPerTradePct / stopDistancePct, capped at 25 % of the account so a tight-stop conviction trade can't monopolise the basket. - Gain to recover —
loss / (1 − loss). Asymmetric: a 50 % drawdown needs +100 % to break even.
The gain-to-recover curve
The arithmetic underneath the badge thresholds. Pure high-school algebra; included to anchor the reader's intuition.
| Loss | Recovery needed |
|---|---|
| 1 % | 1.01 % |
| 2 % | 2.04 % |
| 5 % | 5.26 % |
| 10 % | 11.11 % |
| 20 % | 25.00 % |
| 30 % | 42.86 % |
| 50 % | 100.00 % |
| 75 % | 300.00 % |
Below ~6 % the curve is approximately linear; above it, losses compound exponentially — which is why the 2 % rule matters (Camel Finance, 2024, p. 26).
Basket-level guardrails
The diversification rationale traces back to mean-variance portfolio theory (Markowitz, 1952); sector aggregation is a coarse but defensible proxy when full covariance estimation is too noisy. The pairwise correlation statistic itself is Pearson's linear correlation coefficient (Pearson, 1895) applied to log returns, with the 60-day window and ρ ≥ 0.80 threshold drawn from empirical equity-correlation studies (Roll, 1988) (Bender et al., 2010).
- Sector heat (the 6 % rule) — capital-at-risk percentages roll up by Finnhub industry classification; any sector exceeding the configured ceiling (default 6 %) shows up in the Sector Heat panel of the verdict, with the underlying tickers listed inline (Camel Finance, 2024).
- Sector basket weight — independent flag for sectors exceeding 40 % of the basket by weight even if their stops are tight, so concentration shows up regardless of risk-discipline.
- High-correlation pairs — 60-day Pearson correlation on log returns; pairs with ρ ≥ 0.80 (configurable) are surfaced even when their sectors differ. Sector-blind by design.
User controls (Analysis Settings popup)
| Control | Range | Default | Consumed by |
|---|---|---|---|
| Investor profile | active / long-term | active | narrative copy only |
| Account size | $100 – $10 M | $10,000 | capital-at-risk math |
| Risk per trade | 0.25 % – 3.0 % | 0.5 % / 1.0 % / 1.5 % by tier (Quick / Deep / Elite) | position sizing + Trade Math badge |
| Max sector heat | 2 % – 20 % | 6.0 % | Sector Heat panel threshold |
| Correlation threshold ρ | 0.50 – 0.99 | 0.80 | High-correlation Pairs panel |
Full bibliography for every citation above lives in §References below. Long-form derivations and worked examples matching those citations appear in supplementary methodology notes (risk math).
Confirmation Gate
Before staging an entry rung as live, every long verdict passes through a deterministic three-signal confirmation filter. The goal isn't market timing — it's a delay rule that costs at most one trading day's worth of slippage in exchange for skipping the worst “falling-knife” entries (buy at current price → next-day gap-down → stop-out in one session). The three-signal stack is the swing-trading confirmation checklist popularised in cycle-based trading literature (Camel Finance, 2024) sitting on top of the textbook foundations of price-pattern and moving-average analysis (Murphy, 1999). The same three checks are applied consistently everywhere the gate appears in the product.
The three signals
- Swing-low pattern — A five-bar swing-low pattern on closing prices: the lowest close in the last six bars must sit strictly inside the window (not at either end), and the latest close must be strictly above its prior two closes. Together that confirms a V-shape—the dip and the rebound have both happened (Murphy, 1999, ch. 5) (Camel Finance, 2024).
- 10-SMA reclaim — Today's close is strictly above the 10-day simple moving average. This is the canonical “short-term trend up” filter from the swing-trading literature (Wilder, 1978) (Murphy, 1999, ch. 9).
- MACD bullish — the MACD line is above its signal line—the same rule already reflected in the ticker's technical summary, reused here as a momentum check (Appel, 2005).
Status states & the chip
The entry planner turns those three checks into one status for the levels strip:
- Confirmed — all three signals true on a buy/strong-buy verdict. The chip renders green with a check mark; the “initial” entry is live.
- Pending — buy/strong-buy verdict with at least one signal still missing. The chip renders amber with a clock icon. Entry rungs still compute (position sizing is calculated before this filter) but the user is warned that the setup hasn't proven itself yet.
- n/a — sell or strong-sell verdict. The gate is a long-side filter only, so no chip is rendered.
Hover the chip in the levels strip to see the rationale, the list of signals that fired, and the list still missing. You can verify the gate in one glance without expanding another panel.
Investor-profile framing
The math is universal — every user gets the same flags and the same status. Only the rationale string is profile-aware:
- Active: “Await confirmation — falling-knife risk; missing: …”
- Long-term: “Await confirmation — DCA users may proceed; momentum still mixed; missing: …”
Full bibliography for every citation above lives in §References below. What this gate deliberately does not promise—and common failure modes—are covered in supplementary methodology notes (confirmation signals).
Cycle Position
The cycle module gives each ticker a lightweight, deterministic “where are we in the price cycle?” label — computed entirely from historical closes without involving a language model and with no predictive claim. The concept of measuring price cycles from low to low originates in the practitioner literature (Camel Finance, 2024).
Detection algorithm
We apply a Bry-Boschan-style turning-point detector (Bry & Boschan, 1971) using peak detection on the inverted closing-price series. A minimum prominence of 1 % of the rolling 60-day mean is required to qualify as a cycle low, preventing micro-pullbacks from being counted as troughs. The minimum spacing between lows is set to 60 % of the asset's shorter cycle-window bound, so no two lows sit closer than roughly three fifths of the expected cycle length.
Asset-specific windows
Different asset classes exhibit different typical cycle lengths. Each window bound was derived from the median inter-trough distance measured over a 10-year history and cross-checked against the practitioner reference (Camel Finance, 2024).
| Asset group | Window low (days) | Window high (days) | Notes |
|---|---|---|---|
| SPY / SPX / QQQ / DIA | 36 | 44 | ~40-day daily cycle; most-cited equity window |
| BTC-USD / ETH-USD | 54 | 66 | Stretched relative to equities; measured 2021-2024 |
| GLD / GC=F (gold) | 22 | 28 | Shorter ~25-day gold cycle; back-tested 2015-2025 |
| USO / CL=F (crude oil) | 36 | 44 | Follows equity cycle length empirically |
| Broad default | 36 | 44 | Applied to any ticker not listed above |
What each verdict shows
The cycle strip on a verdict uses the following quantities:
| Quantity | Meaning |
|---|---|
| Days since last swing low | Trading days elapsed since the most recent confirmed trough. |
| Cycle stage (early / mid / late) | Early: first segment of the typical window; mid: past that but not yet extended; late: stretched versus the long end of the window. |
| Translation (left / mid / right) | Where the most recent intra-cycle high fell relative to the midpoint of the window. Right means the high occurred in the latter part of the window. |
| Shorter window bound (days) | Lower end of the asset's typical cycle length in trading days. |
| Longer window bound (days) | Upper end of that typical cycle length. |
| Recent cycle lows | Reference points for the last few detected troughs. |
| Price at last low | Closing level at the most recent trough—shown in the tooltip. |
Backtest results
To determine whether cycle translation carries predictive value, we ran a 10-year rolling backtest (approx. Jan 2015 – Jan 2025) across four liquid assets. At each bar we fed the preceding 252 trading days into the detector, recorded the translation label of the completed cycle, and measured the outcome:
Δ low = (next cycle low price − current cycle low price) / current cycle low price. A positive value means the next trough is higher than the current one — a bullish outcome.
Sample sizes and mean Δ low by translation type are shown below. The “Lift vs Left” column is (mean_right − mean_left) / |mean_left|, measuring whether right-translated cycles produce a better outcome than left-translated ones. Per Bailey & López de Prado (Bailey & López de Prado, 2014), we applied a ≥ 5 % absolute lift threshold to guard against overfitting on a limited sample.
| Asset | Window | n Right cycles | n Left cycles | Mean Δ (right) | Mean Δ (left) | Lift vs Left |
|---|---|---|---|---|---|---|
| SPY (S&P 500 ETF) | 36–44d | 128 | 38 | +0.5% | +1.5% | −66.1% |
| QQQ (Nasdaq-100 ETF) | 36–44d | 130 | 34 | +0.7% | +0.1% | +532.8% |
| GLD (Gold ETF) | 22–28d | 140 | 84 | +0.3% | +1.0% | −65.8% |
| BTC-USD (Bitcoin) | 54–66d | 124 | 88 | +4.9% | +1.4% | +251.9% |
Finding: The direction of the lift is inconsistent across asset classes. Right-translation appears favourable for QQQ and BTC-USD, but unfavourable for SPY and GLD. This rules out right-translation as a universal predictor. Note also that the absolute mean Δ values are small (all below 5 %) and the left-translation sample sizes are substantially smaller than right-translation, increasing variance.
Decision: Cycle position is offered as descriptive context only. The Market Analyst receives a single sentence — e.g. “Cycle context: 21 days since last swing low; historical window: 36–44 days; current cycle mid-stage, right-translated.” — explicitly described as background context, not an added score on the recommendation. No scoring bonus or penalty is applied in the analysis.
Where it appears in the UI
A cycle strip is rendered below the Trade Math block on each verdict card. It shows the current stage, days since the last low, the asset's expected window, and the translation label. Hovering over the strip reveals the last low price and how far through the window the current cycle is.
Execution Realism
TickerTape now adjusts the model's stop/target math for trade friction and stale-thesis risk before a verdict clears the risk gate. The goal is simple: a setup should still work after estimated spread/slippage and after the catalyst window has passed, not only in a frictionless spreadsheet.
Slippage-adjusted R:R
Execution cost is estimated from 20-day average volume and applied as a round-trip haircut to the reward side of R:R. The model uses conservative liquidity buckets rather than a full optimal-execution model because TickerTape does not yet know order size, bid/ask spread, or participation rate. The design follows the intuition of optimal execution and implementation shortfall research (Almgren & Chriss, 2000).
| 20d average volume | Cost per side | Round-trip haircut |
|---|---|---|
| > 10M shares | 10 bps | 0.20% of price |
| 1M–10M shares | 25 bps | 0.50% of price |
| < 1M or unavailable | 50 bps | 1.00% of price |
Effective reward is the target gain minus round-trip execution cost (not less than zero). Effective risk/reward is that net reward divided by the dollar risk to the stop. The gate uses this adjusted figure, so a setup that looks like 1.5R before friction can still fail once cost is included.
Time stops
Each risk report includes a calendar time-stop date. If a dated catalyst exists, the stop date is that catalyst plus seven calendar days. Otherwise it is today plus the Trader Report's expected holding window. This follows the information-horizon idea that a thesis decays when the expected event passes without confirmation (Grinold & Kahn, 1999) and the practitioner time-stop discipline documented in trading literature (Schwager, 2017).
ATR-spaced entries
Bullish entry rungs are now spaced by ATR units instead of fixed interpolation points: market, −1× ATR, −2× ATR or support, and −3× ATR or support. ATR comes from Wilder's volatility framework (Wilder, 1978). This makes high-volatility names spread entries farther apart while low-volatility names keep tighter, more realistic pullback levels.
Assumptions and limits of the slippage and time-stop model are spelled out in supplementary methodology notes (execution realism). The verdict already reflects time stops and execution cost; future updates may surface them more prominently on the card.
Debate Discipline
Bull and Bear Advocates emit JSON claims; each claim names a supporting analyst and a verbatim quote from that analyst's fullReport. A deterministic validator drops any claim whose quote is not a substring of the cited report. The Research Evaluator emits a stance + stance probabilities (bull/bear/neutral, summing to 1); the trader's raw conviction is multiplied by max(p), then by debateDisagreementConvictionFactor = 0.85 if the rating direction disagrees with the stance.
Code: lib/multi-agent/agents/debateValidator.ts, researchEvaluator.ts, traderReport.ts. Full intuition + RAG-grounding rationale in the thesis §8.
Calibration Loop
Every verdict is persisted as VerdictSnapshot; resolved paper trades feed an observed win rate. Once closedDirectedTrades ≥ 30 the system raises the R:R floor to 1/p − 1 + 0.3; the user's setting always wins if stricter. Live numbers go to /dashboard/performance. Full derivation + the why we do not publish Sharpe on small samples argument in the thesis §10.
TickerTape vs TradingAgents
| Layer | TradingAgents (paper) | TickerTape |
|---|---|---|
| Macro Analyst | ❌ absent | ✅ live FRED — 8 base series + up to 6 sector overlays |
| Sector-aware overlays | ❌ absent | ✅ banks see credit spreads, homebuilders see mortgage rates |
| FRED ToS compliance | n/a | ✅ raw observations never reach language models — only derived signal labels |
| Basket macro context | ❌ absent | ✅ basket-level tailwinds/headwinds included when weights are set |
| Natural-language FRED explorer | ❌ absent | ✅ /macros page with AI-powered chart generation |
| Alternative Data agent | ❌ absent | ✅ congress trades, lobbying filings, government contracts |
| Dividend & income ROI | ❌ absent | ✅ annual yield %, income per $10k, total return at target |
| Deterministic Entry Planner | ❌ absent | ✅ 2–4 entries anchored to live technicals — no language-model arithmetic |
| Portfolio Builder | ❌ absent | ✅ deterministic similarity grouping + sector concentration flag |
| Full risk report | ❌ absent | ✅ 350–550 word per-ticker risk report with stop/target rationale |
| Progress visibility | batch output | ✅ live step-by-step progress and an activity log in the UI |
| Model selection | fixed | ✅ per-tier model overrides with hybrid research/synthesis splits |
References & Data Sources
References — the full numbered bibliography for every academic and practitioner source cited on this page lives in the thesis: §16 References →. Inline (Author, Year) chips on this page jump straight to the matching numbered entry in that bibliography.
Data sources & licenses
TickerTape runs on three primary market-data feeds plus a roster of news and social-sentiment providers. Brand marks are reproduced for identification only and remain the property of their respective owners.
Provider data for each analysis is fetched when you run it. Short-lived server caching keeps the session responsive. We do not resell or republish third-party market databases as standalone products.
 Federal Reserve Economic Data (FRED)Federal Reserve Bank of St. Louis. Live macroeconomic time series powering the Macro Analyst — 8 base series plus up to 6 sector overlays.License: FRED Terms of Use (June 2024 revision). Raw observations are never fed to language models — only derived signal labels computed on the server first. See §5 Macro Layer for the full compliance walkthrough.
 Finnhub Stock APIReal-time fundamentals, industry classification (used by the sector-heat roll-up), insider transactions, congressional trading, government contracts, and supplemental news.License: commercial terms, Finnhub Terms of Service. Access tier-dependent; rate-limited per API key.
 Yahoo FinanceEnd-of-day and intraday OHLCV history, dividends, splits, corporate actions, and headline RSS feeds. Pulled using the open-source
yfinancelibrary (Ran Aroussi) as part of our price-history service.License: subject to Yahoo's Terms of Service. No redistribution of bulk historical data; intended for research and personal use.
News & sentiment aggregators
The News Analyst aggregates headlines from the following providers and the social-sentiment layer pulls from public community signals. All assets used for identification only.
 BloombergFinancial news headlines
 RedditSocial sentiment (aggregate)
 X (Twitter)Social sentiment (aggregate)
 MarketauxMulti-source news API
 Google NewsRSS ticker feed
 Bing NewsNews API search
 Alpha VantageNews & sentiment API
 FinvizCurated news & screener
 MarketWatchFinancial news headlines
 Seeking AlphaEquity research & news